by Sheri Rosalia | Sep 22, 2020
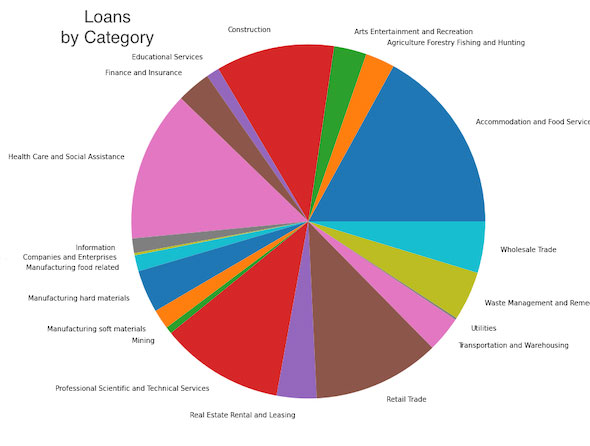
Data Engineering applied to the Paycheck Protection Program Cash for COVID Clean Machine Pipeline DATA PIPELINE VISUALIZATIONS LARGE LOANS EXPLORE THE PEOPLE CALIFORNIA BUSINESS TYPES BY RACE Unprecedented access to small business loan data It seems that no section of...
by Sheri Rosalia | Sep 22, 2020
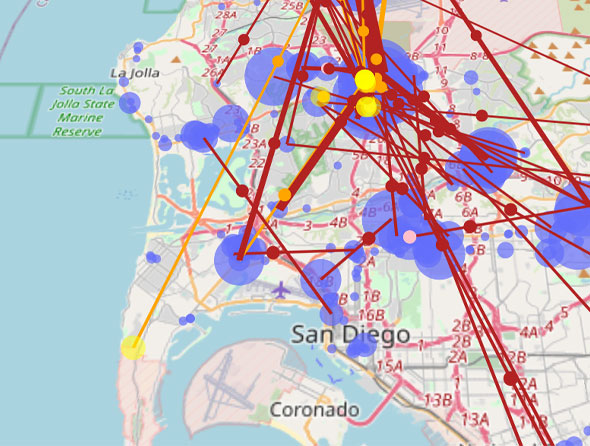
Data analysis applied to identifying illegal trends and bad actors in the massage industry Identifying Illicit Massage Locations Permeating San Diego: dubious massage locations Research supports a strong assertion: The massage industry in San Diego has been...
by Sheri Rosalia | Sep 22, 2020
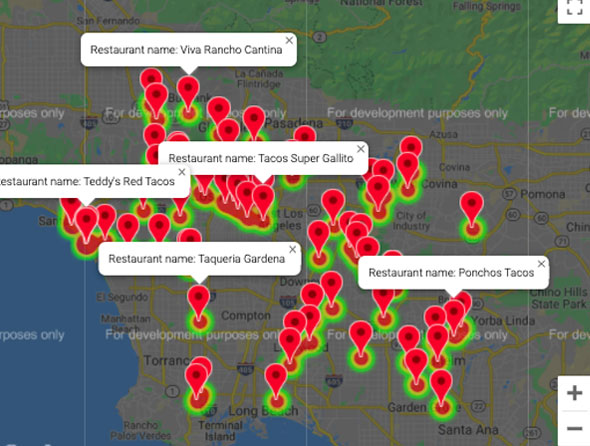
Statistical Analysis of Yelp restaurant ratings Want to chow down in L.A.? 20,000 restaurants analyzed What does rating and review data reveal about the Los Angeles, California food scene? Let’s take a look at data on almost 20,000 eateries which was retrieved...
by Sheri Rosalia | Sep 22, 2020
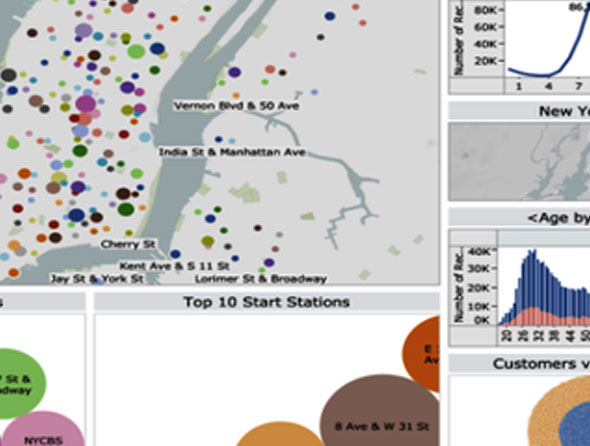
Tableau for the Citi Data extraction, normalization and analysis the NY Citi way New York Citibike analysis NY State government and Citibike combined forces to provide bike rentals throughout the Greater Manhattan area, and the customer information such as gender,...
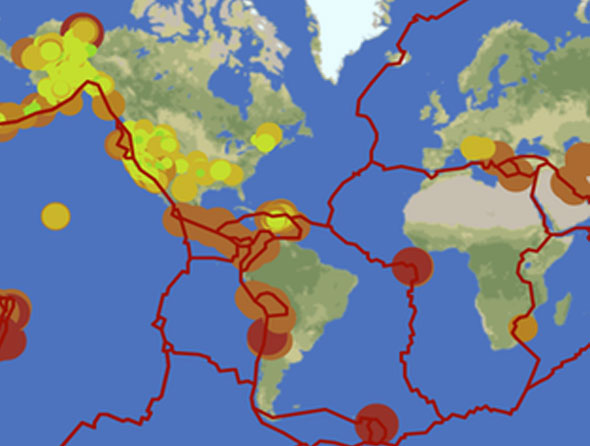
by Sheri Rosalia | Sep 14, 2020
Geomapping: Earthquake Visualization "We learn geology the morning after the earthquake." -Ralph Waldo Emerson Geomapping Seven days of earthquakes This interactive map allows the user to view seven days of earthquake activity from the U.S. Government. Utilization of...