
Sheri Rosalia | Data Engineer
Every Business Needs a Compass, let data lead the way.
Data Engineer | Data Analyst | Data Scientist
What can you do with the superpowers of data?
Explore how the application of data analysis can transform aggregate information into meaningful insights for your business. These data projects incorporate different aspects of data engineering, data visualization and data analysis that can all be applied to solve “real life” problems to make best decisions. I hope you have some fun while exploring them.
Wrangling, normalizing, architecting and unveiling the tales data collections hold within benefits all aspects of business. I have used the technologies illustrated in the projects linked below to enable entrepreneurs choose optimal business locations, allocate advertising expenditures efficiently and improve productivity by automating tasks.
If you would like to explore what data engineering and analytics can do for you or how I can be of service to your organization, please do not hesitate to reach out and schedule a complimentary consultation.
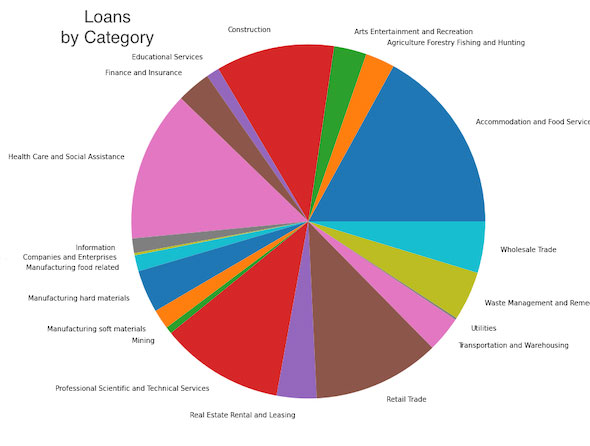
Cash for COVID, Clean Machine Pipeline
Environment: SQL, Python, Python Pandas, PySpark, Scikit-learn, Google Colab, HTML, CSS, ETL, PostgresSQL, JavaScript, Pipeline
Legal or Illicit Forensic Analysis
Environment: Geocoding, Plotly, Google Maps, Python, Scrapy, Pandas, JavaScript, SQL, PHP, NLTK, HTML, CSS, Google Sheets, Excel
Statistical Analysis Stars of L.A.
Environment: Python, Pandas, Google Maps, HTML, CSS, Microsoft Excel
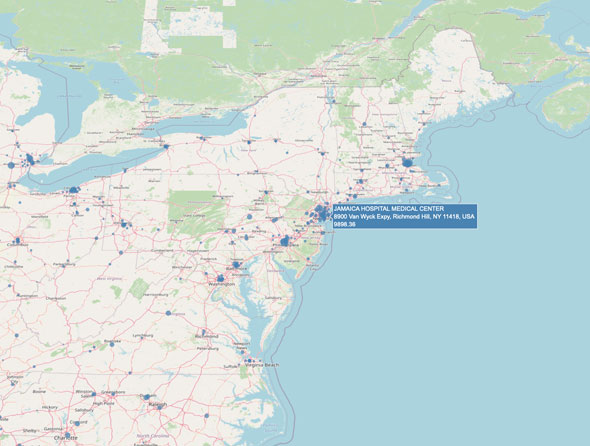
CMS Hospital Payments
Environment: Python, Socrata API, Plotly.js, Google API, Tableau
Chrome Browser Grub or Grubby?
Environment: API, JavaScript, Google Developer
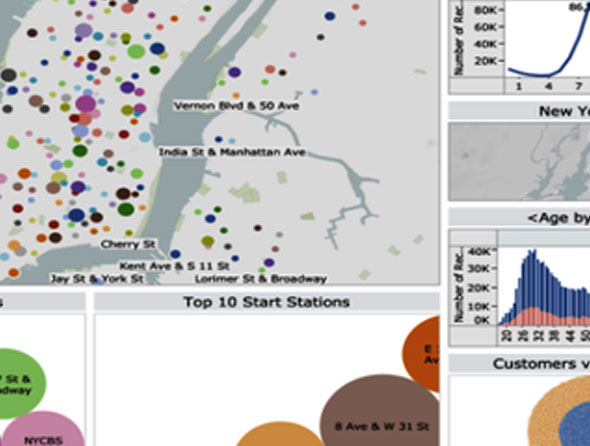
Tableau for the City
Environment: Python, Requests and Tableau
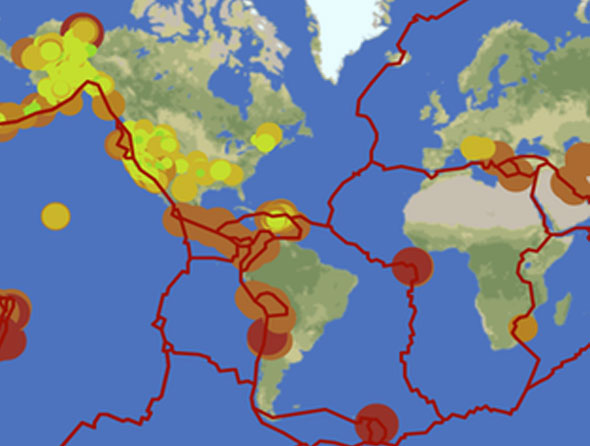
Geomapping
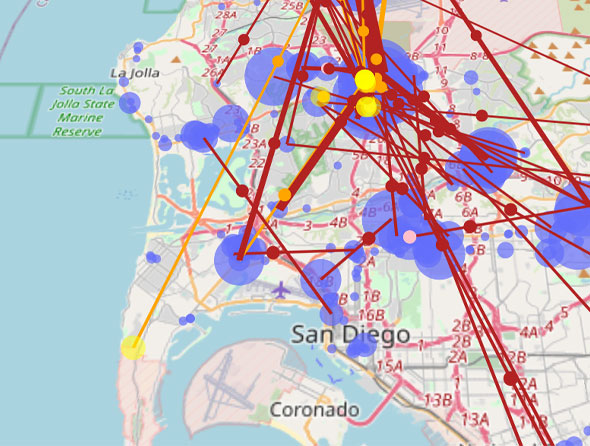
Realtime data earthquake visualization from U.S.G.S API data. Leverage GIS U.S. government data for geo-mapping visualization which allows the user interface with dynamic earthquake activity.
Environment: Python, Leaflet, D3.js, HTML, CSS, JavaScript, API

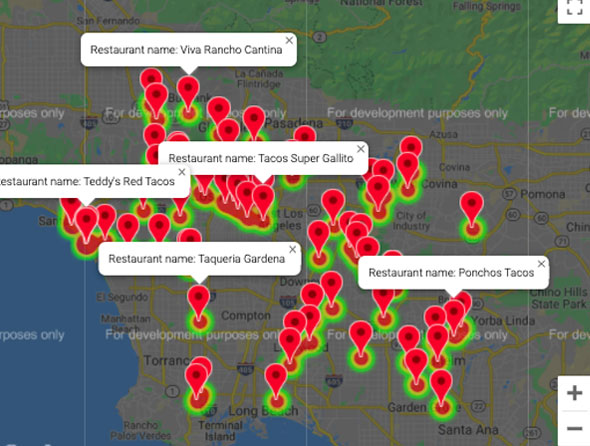
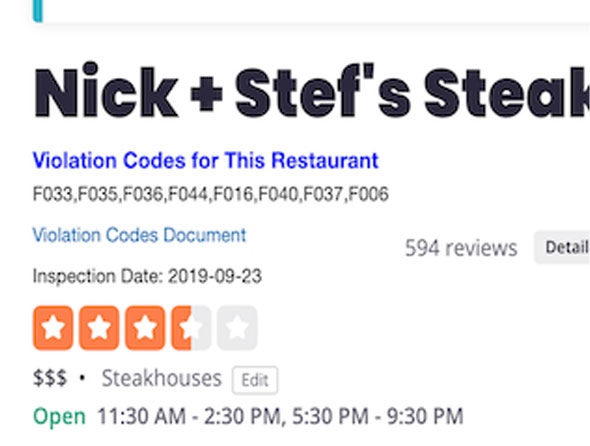
Dirty Rats Machine Learning
Machine learning predictive analysis to identify potential rodent infestations in Los Angeles, California restaurants with 87.8% accuracy. Information sourced from Yelp Developer API and Los Angeles, California open government program. Data engineered through processes of normalization, cleansing and modification to meet requirements of machine learning modalities.
Environment: Python, Python Pandas, Scikit-Learn
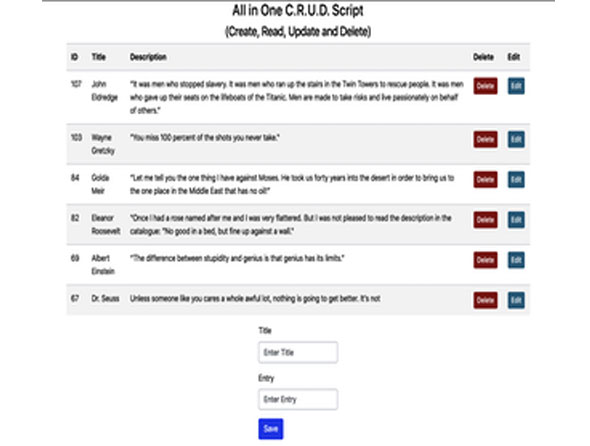
Single Page C.R.U.D
Database management via web application. Single page template to allow easy integration into existing website. CRUD (Create, Read, Update, and Delete) user interface. PHP back end for ease of deployment in likely hosting choices for small business clients.
Environment: PHP, MySQL, MariaDB, Javascript, HTML, CSS