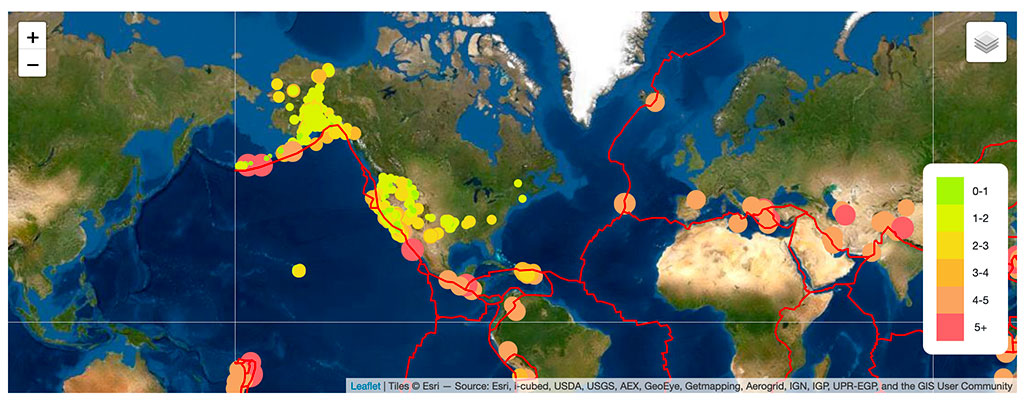
Geomapping: Earthquake Visualization
"We learn geology the morning after the earthquake." -Ralph Waldo EmersonGeomapping Seven days of earthquakes
This interactive map allows the user to view seven days of earthquake activity from the U.S. Government.
Utilization of the selection tool in the upper right hand corner changes basemap and quake data interaction.
Coding tools for this visualization were from Leaflet.js, D3.js, html and css. Maps and data sources are courtesy of mapbox, esri_worldImagery, fraxen tectonicplates on github.com, and USGS.gov.
All project code and notes
Fork or clone from the GitHub repository.
Visualization of seven days of earthquakes
Sheri Rosalia | Data Engineer
Data Engineer | Data Analyst | Data Scientist

