Engineering and analyzing content from OpenData.gov
Data analysis of CMS payments to teaching hospitals 2018Data engineering and analysis of monies given to our hospitals
This project is an offshoot of an analysis I did for a client evaluation whether or not to invest in a drug manufacturer and in my journey to identify appropriate resources, I encountered all sorts of information identifying relationships between pharmaceutical companies and our medical universities. You are invited to journey through some quick observations through a few charts and maps as seen below.
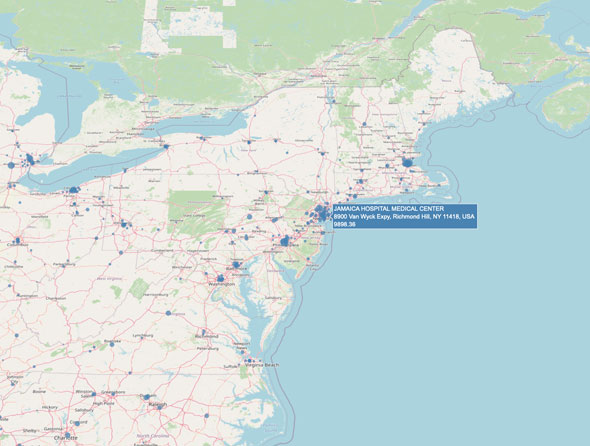
The data for this project came from the United States government via the website OpenData.gov and is provides as a part of a national transparency program. The map displays hospital locations and total monies received in 2018 using data reported by the Centers for Medicare and Medicaid Services and was retrieved using the Open Payments API .
All project code and notes
Fork or clone from the GitHub repository.
Data engineering to map the money
I used a live connection known as an “API” provided by the government to encourage developers to create projects in the interest of public education. The API allowed the to extraction of names, locations and sum of payments to each hospital from the dataset. Clicking on the image below will redirect you to an interactive map displaying these results.
The diseases are we investing in
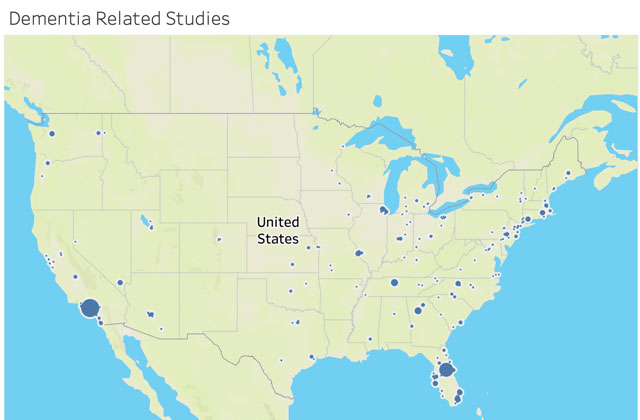
Data analysis suggests that cancer treatment receives the most funds, however dementia research seems to get nationwide support and investment as shown by the map below.
Data suggests US Investment is king
As illustrated in the piechart below, drug companies and medical device manufacturers represent the largest investment by far, and all foreign investors combined is less than 5%.
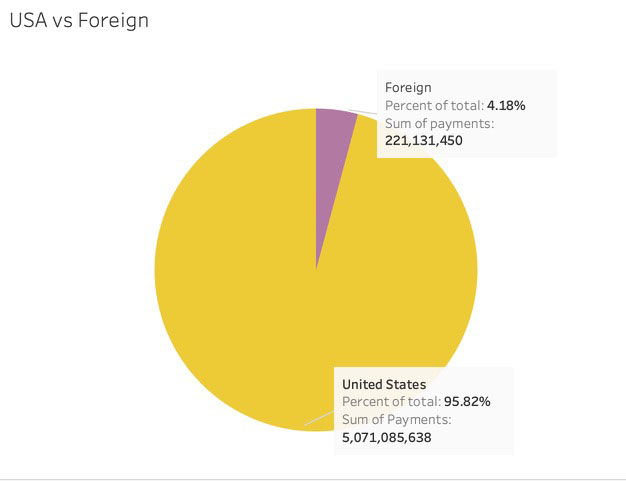
A The countries who make up $221 million dollars of the pie
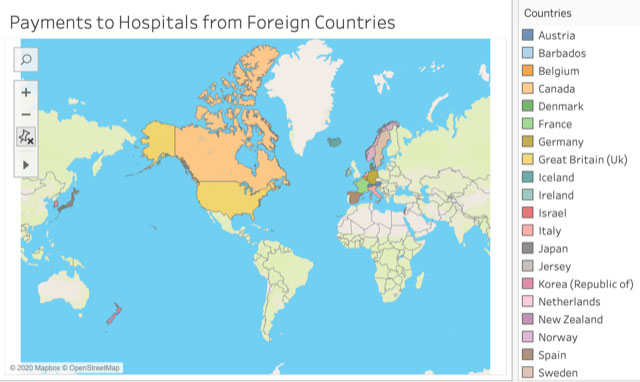
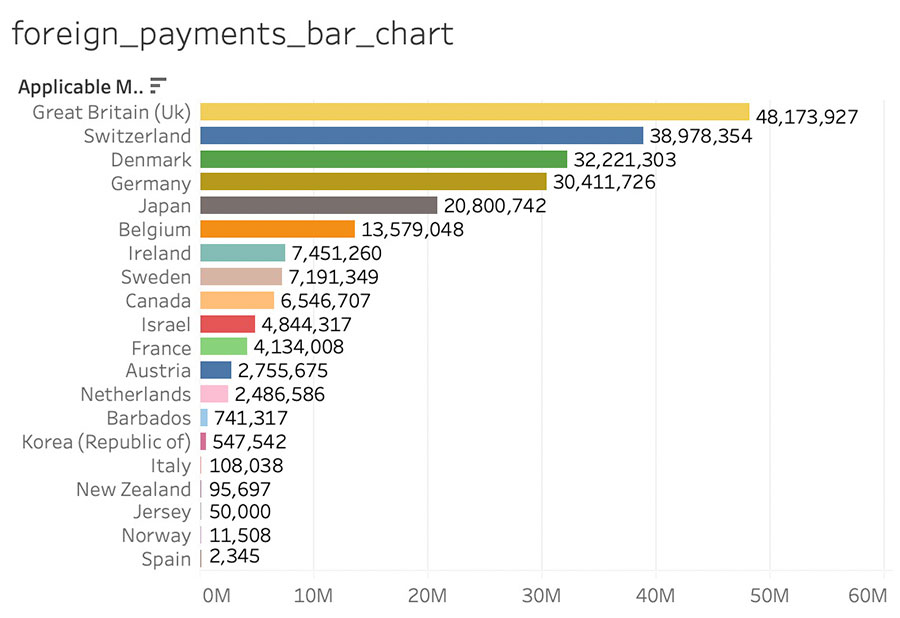
Country investment by ranked
Great Britain leads the way in sum of monies paid
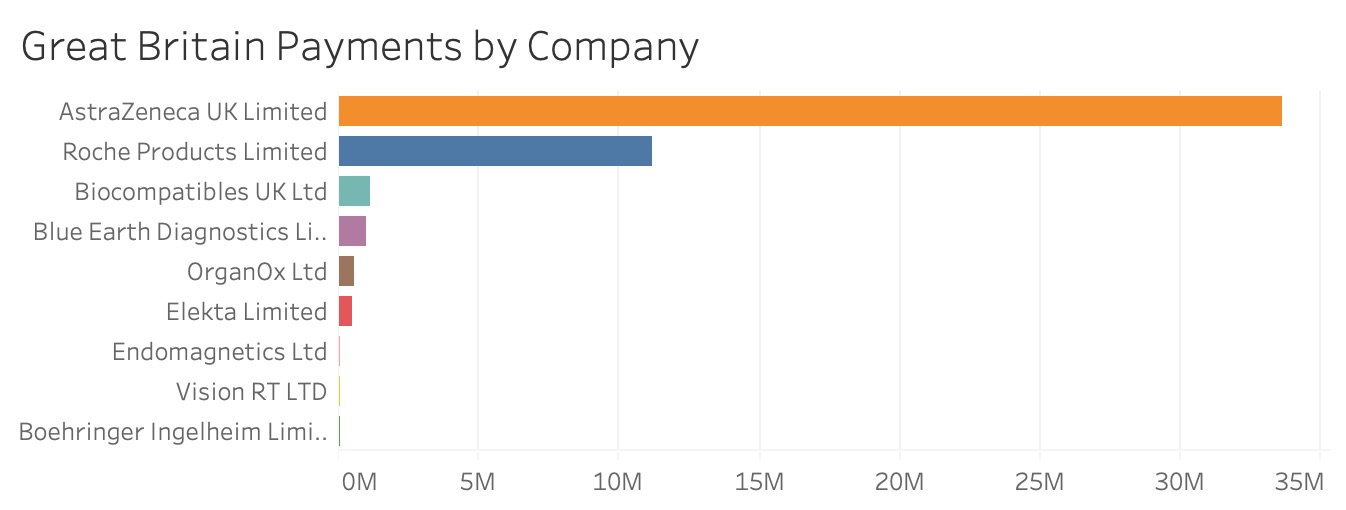
Great Britain’s leading investor: AstraZeneca
The data for 2018 shows that AstraZeneca outstripped other manufacturers as seen by the bar chart below.
AstraZeneca payments
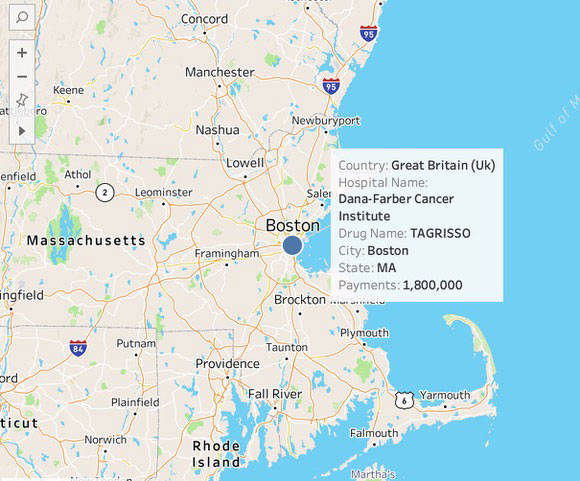
The drug Tagrisso which aids in pulmonary cancer treatment seemed to be AstraZeneca’s main investment and the vast majority of the money went to the Dana Farber Cancer Institute in Boston.
Next steps
The analysis above simply illustrates the kind of level of detail that can be explored. In this case we happened to touch upon foreign investment, but the story this data might tell and the journey we can take to uncover the stories seems to have a tremendous amount of potential. The data sets are packed with all sorts of information including physician names, dates of payments, drug study types, hospital location and foreign investment amounts just to name a few. What is explored here is simply the “tip of the iceberg”. Additionally, the data available to analyze spans 2013-2019. Multi year data provides the opportunity to identify trends and postulate future investment projections. As the data journey continues, the story will be shared here. Thank you for reading to the end and please stay tuned!
Sheri Rosalia | Data Engineer
Data Engineer | Data Analyst | Data Scientist

